How Do You Read a Nutrition Label in 60 Seconds?
To read a nutrition label in 60 seconds, start with the serving size, then scan the %DV column: 5% DV or less per serving is low and 20% DV or more is high. Look hardest at added sugars, sodium and saturated fat, and multiply every line if you eat more than one serving. Below, a cereal, a yogurt and a frozen meal label are read line by line with the math shown.
Quick answer
5% low, 20% high FDA quick guide to %DV · per serving · based on a 2,000-calorie day
Check the serving size first, then the %DV column: 5% DV or less per serving is low, 20% DV or more is high. Keep added sugars, sodium and saturated fat low; push fiber, calcium and iron up.
FDA Nutrition Facts label guide (content current as of 03/05/2024) and FDA Added Sugars page (03/04/2026) · Dietary Guidelines for Americans 2025–2030 · WHO sodium fact sheet (11 May 2026) · checked 2026-10-20 · the three labels below are illustrative examples, not specific brands
The 60-second order for reading a nutrition label
The Nutrition Facts panel on packaged food in the US follows the same layout on every product, which is what makes a fast read possible. The FDA describes it in four parts: serving information at the top, then calories, then the nutrient lines, and the Percent Daily Value (%DV) column running down the right side. If you read a nutrition label in that order every time, the panel stops looking like a wall of numbers.
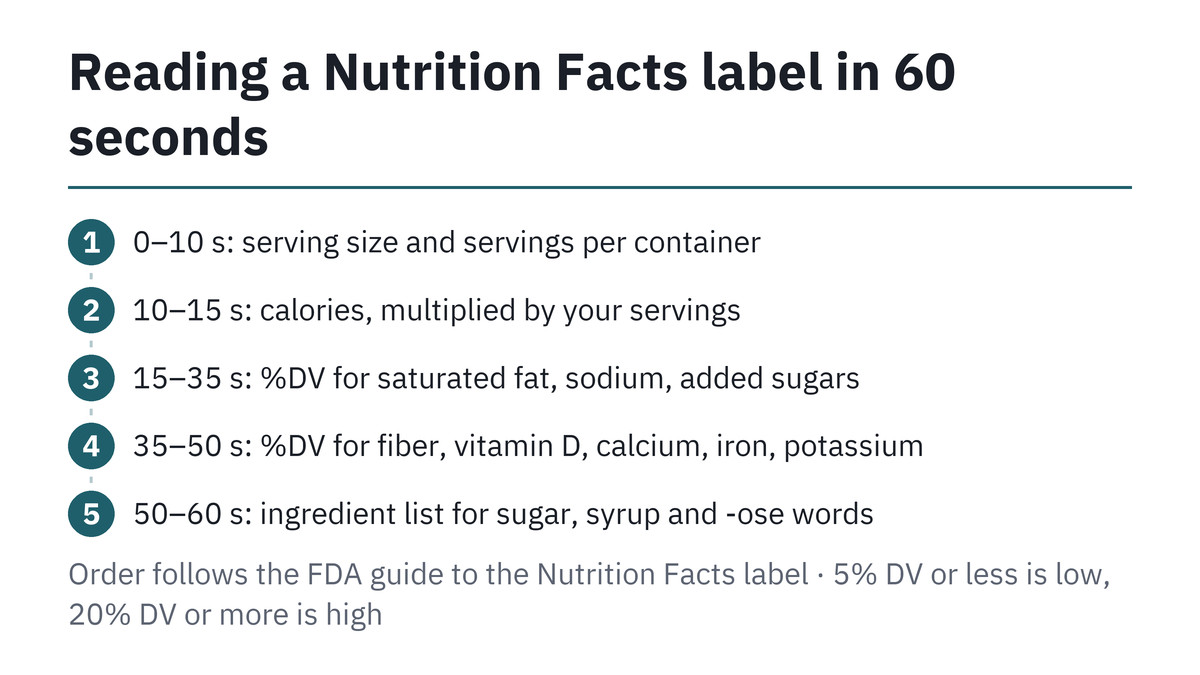
- Seconds 0–10: read the serving size and servings per container, and decide how many servings you will actually eat
- Seconds 10–15: read calories and multiply by the number of servings you just decided on
- Seconds 15–35: scan the %DV for saturated fat, sodium and added sugars, the three lines the FDA lists as nutrients to get less of
- Seconds 35–50: scan the %DV for dietary fiber, vitamin D, calcium, iron and potassium, the nutrients to get more of
- Seconds 50–60: glance at the ingredient list for words that contain sugar or syrup or end in -ose
The order matters because the top line controls everything under it. Every gram and every percentage on the panel describes one serving. If the serving is one cup and you pour two, every number you read afterward is half of what you are eating, so checking the serving size first saves you from reading the rest of the label wrong.
Calories come next because they tell you how much energy that portion carries. The FDA uses 2,000 calories a day as a general guide for nutrition advice and notes that individual calorie needs vary. You do not need to know your own number to use the label well; the %DV column already does the comparison against a 2,000-calorie day for you.
Tip · The label is per serving, not per package Unless the panel says the package is one serving, the numbers describe only part of what is inside. Multiply before you compare.
Serving size: the line that changes every other number
Serving sizes on US labels are standardized so that similar foods can be compared, and they are based on the amount people typically eat or drink. The FDA is direct about what they are not: a serving size is not a recommendation of how much you should eat or drink. It is a unit of measure, and the rest of the panel is built on it.
The FDA’s own sample label uses a frozen lasagna with a serving size of one cup and 280 calories. Eat two cups and you take in 560 calories, along with double the fat, sodium and everything else on the panel. The same multiplication applies to the %DV column, so a 15% sodium line becomes 30% of the daily value at two cups.
| How much you eat | Multiply the label by | Calories (label shows 280) |
|---|---|---|
| 1 cup (one serving) | 1 | 280 |
| 1½ cups | 1.5 | 420 |
| 2 cups | 2 | 560 |
The quickest fix is to measure your usual portion once. Pour cereal into your normal bowl, then tip it into a measuring cup. Do the same for pasta, rice or yogurt. Most people only need to do this a handful of times to learn what their own portion looks like next to the serving on the box.
Servings per container matters for snacks and single-meal packages. A bag of crackers that looks like one snack may hold several servings, and a frozen meal tray can hold two. When you plan to finish the package, multiply the whole panel by the servings-per-container number instead of your own estimate.
Percent Daily Value and the 5/20 rule
The %DV shows how much one serving contributes to a full day of that nutrient, on a scale from 0 to 100%. It saves you from doing the math against a reference amount. The FDA gives a simple guide for reading it: 5% DV or less of a nutrient per serving is considered low, and 20% DV or more is considered high.
Low and high are not good and bad by themselves. For saturated fat, sodium and added sugars, the aim is a lower %DV. For dietary fiber, vitamin D, calcium, iron and potassium, the FDA notes that many Americans do not get enough, so a higher %DV is usually what you want. The same 20% can be a warning on the sodium line and a plus on the fiber line.
| Nutrient | Daily Value used for %DV | Usually aim for |
|---|---|---|
| Saturated fat | 20 g | Lower %DV |
| Sodium | 2,300 mg | Lower %DV |
| Added sugars | 50 g | Lower %DV |
| Dietary fiber | 28 g | Higher %DV |
| Calcium | 1,300 mg | Higher %DV |
| Iron | 18 mg | Higher %DV |
| Potassium | 4,700 mg | Higher %DV |
| Vitamin D | 20 mcg | Higher %DV |
You can turn any gram or milligram figure into a %DV yourself: divide the amount by the Daily Value and multiply by 100. A serving with 690 mg of sodium works out to 690 ÷ 2,300 × 100 = 30%. This is useful when you eat a portion that is not on the label, because you can multiply the grams first and then convert.
Two more points from the FDA guide prevent common misreadings. First, the %DV column does not add up vertically to 100%; each line is measured against its own daily amount. Second, %DV comparisons only work when the serving sizes match, so line two products up at the same weight or volume before deciding which one is lower in sodium or higher in fiber.
Example 1: a breakfast cereal label
This example label is modeled on a typical sweetened flake cereal. The numbers are illustrative, but the math is the same on any box: one serving is 1 cup (40 g), and the column on the right shows what a 2-cup bowl really delivers.
| Label line | Per 1 cup (40 g) | %DV per cup | 2-cup bowl |
|---|---|---|---|
| Calories | 160 | — | 320 |
| Sodium | 200 mg | 9% | 400 mg (17%) |
| Total carbohydrate | 34 g | 12% | 68 g (25%) |
| Dietary fiber | 3 g | 11% | 6 g (21%) |
| Total sugars | 12 g | — | 24 g |
| Includes added sugars | 10 g | 20% | 20 g (40%) |
| Iron | 8.1 mg | 45% | 16.2 mg (90%) |
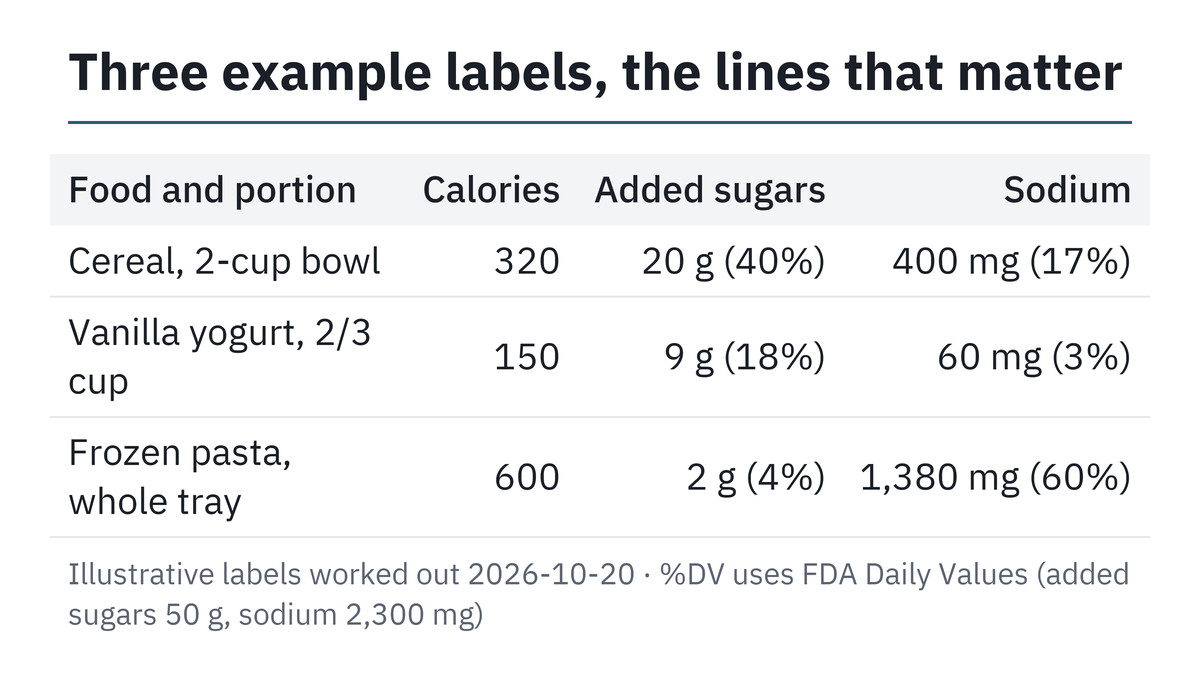
Start with the serving: 1 cup. Then calories: 160 per cup, 320 for the bowl. On the lines to limit, sodium sits at 9% per cup, between low and high. Added sugars sit at 20% per cup, which already meets the FDA’s high mark. At two cups, the bowl carries 20 g of added sugars, 40% of the 50 g Daily Value before the day has started.
The Dietary Guidelines for Americans 2025–2030 give a second yardstick: one meal should contain no more than 10 grams of added sugars. One cup of this cereal reaches that line exactly, and the 2-cup bowl doubles it. On the lines to get more of, iron at 45% per cup is high, which is common in fortified cereals, and fiber at 11% per cup is moderate.
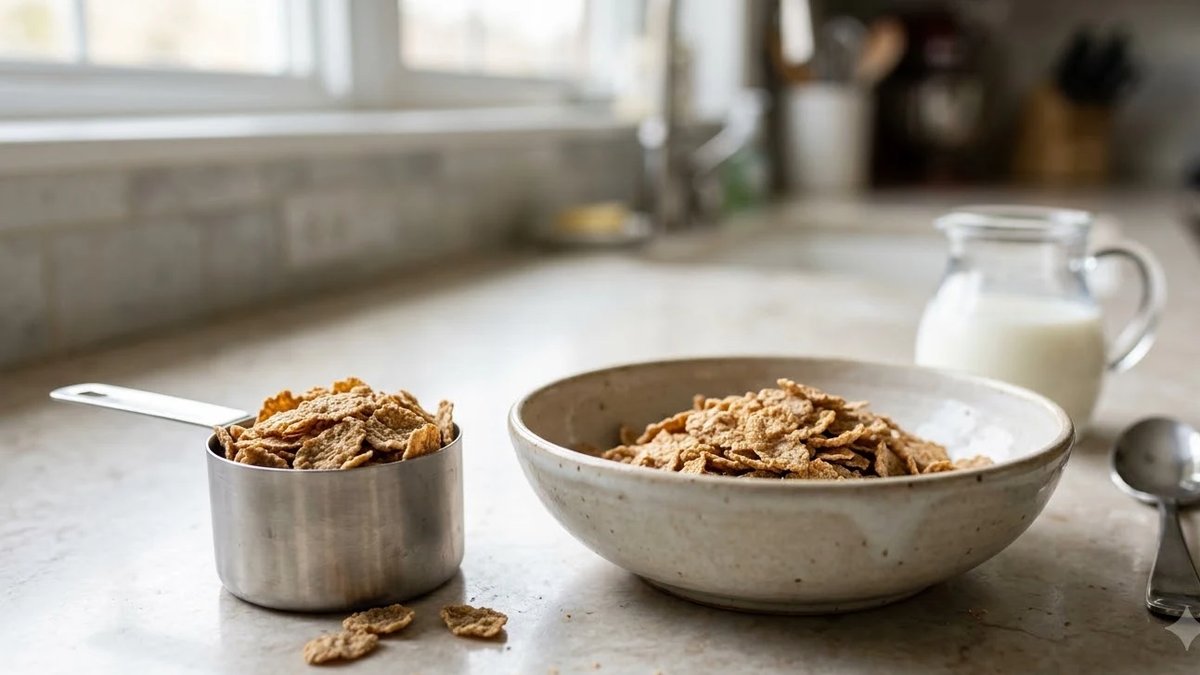
A high iron number does not cancel a high added-sugar number; the label simply shows both. The practical moves are small: measure one cup instead of filling the bowl, or compare the box with an unsweetened cereal at the same serving size, where the added sugars line can drop to a gram or two. Adding fresh fruit changes the total sugars line but not added sugars, because the guidelines do not count the sugars naturally present in fruit as added sugars.
Tip · Milk is not part of the cereal panel The panel usually describes the dry cereal. Milk brings its own calories and its own naturally occurring sugar, so read the milk carton separately.
Example 2: plain vs vanilla yogurt
Yogurt is where the difference between total sugars and added sugars is easiest to see. Both example labels below use the same serving, 2/3 cup (170 g), so the %DV numbers can be compared directly.
| Label line | Plain nonfat Greek | Vanilla nonfat Greek | Reading |
|---|---|---|---|
| Calories | 100 | 150 | 50 more in vanilla |
| Total sugars | 5 g | 14 g | Includes milk sugar |
| Includes added sugars | 0 g (0%) | 9 g (18%) | The real gap |
| Protein | 17 g | 14 g | Both high |
| Calcium | 190 mg (15%) | 160 mg (12%) | Similar |
| Sodium | 60 mg (3%) | 60 mg (3%) | Low in both |
The plain cup shows 5 g of total sugars and 0 g added. Those 5 grams are the sugar that is naturally present in milk; the guidelines state that sugars in plain milk are not considered added sugars. The word includes on the label means the added sugars are already counted inside the total sugars figure, so the vanilla cup has 14 g of sugar in all, 9 g of which were added.
At 9 g, the vanilla cup shows 18% DV, just under the 20% high mark. A second benchmark is stricter. For dairy snacks such as yogurt, the 2025–2030 guidelines point to the FDA healthy claim limit of 2.5 g of added sugars per 2/3 cup equivalent. This example vanilla cup carries more than three times that, and it would use up most of a 10 g per-meal allowance on its own.
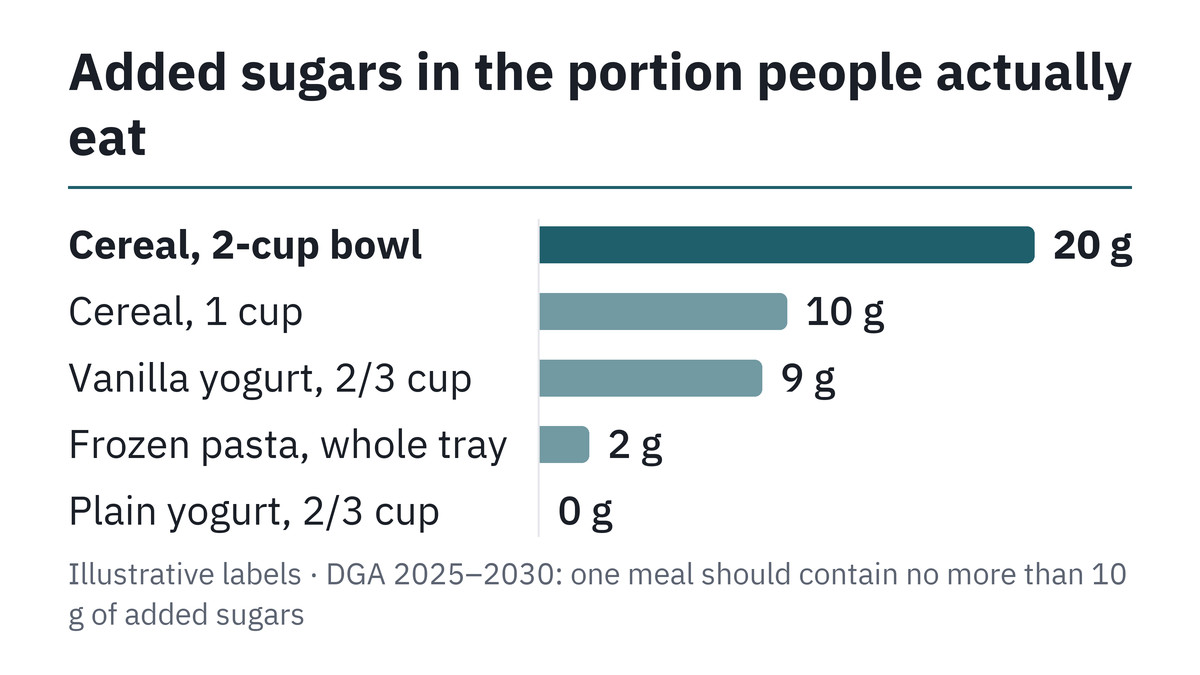
If you like the flavored version, mixing half plain and half vanilla gives about 4.5 g of added sugars in a 2/3 cup serving, by simple averaging of the two labels. Plain yogurt with fruit is another route: the fruit adds total sugars and fiber, but no added sugars. Protein and calcium stay close in both cups, so the trade is mostly about sugar and the extra 50 calories.
Example 3: a frozen pasta meal with two servings in one tray
Frozen meals are where the servings per container line catches the most people. This example tray looks like a dinner for one, but the label lists two servings of 1 cup each. Read the per-serving column, then double it for the whole tray.
| Label line | Per serving (1 cup) | Whole tray | %DV, whole tray |
|---|---|---|---|
| Calories | 300 | 600 | — |
| Saturated fat | 5 g (25%) | 10 g | 50% |
| Sodium | 690 mg (30%) | 1,380 mg | 60% |
| Dietary fiber | 3 g (11%) | 6 g | 21% |
| Added sugars | 1 g (2%) | 2 g | 4% |
Per serving, sodium already reads 30% and saturated fat 25%, both above the 20% high mark. Eat the whole tray and the meal holds 1,380 mg of sodium, 60% of the 2,300 mg Daily Value, plus half of the day’s 20 g saturated fat reference. Added sugars are low here at 2 g for the tray, which shows why scanning only one line can mislead you.

Set against the World Health Organization recommendation for adults of less than 2,000 mg of sodium a day, the full tray uses 69% of that limit in a single meal. Under the US guideline of less than 2,300 mg for people 14 and older, it leaves 920 mg for everything else eaten that day, including bread, cheese and sauces, which also carry sodium.
Two practical options follow straight from the label. Eat one serving and fill the plate with a salad or plain vegetables, which roughly halves the sodium and saturated fat of the meal. Or compare brands at the same serving size and pick the one with the lower sodium %DV; the FDA notes that the %DV also helps you tell apart claims such as light, low and reduced without memorizing their definitions.
Added sugars vs total sugars, and the ingredient list
Total sugars covers every sugar in the serving, including those naturally present in milk and fruit. Added sugars is the part that was put in during processing: sugars, syrups, honey and sugars from concentrated fruit or vegetable juices. The FDA sets the Daily Value for added sugars at 50 grams per day on a 2,000-calorie diet.
The ingredient list backs up what the panel says and shows where the sugar comes from. The Dietary Guidelines suggest a simple scan for words that include sugar or syrup or that end in -ose, and they name many of the forms added sugars take on a label:
- Syrups: high-fructose corn syrup, corn syrup, agave syrup, rice syrup
- Words ending in -ose: fructose, glucose, dextrose, sucrose, maltose, lactose
- Named sugars: cane sugar, beet sugar, turbinado sugar
- Others: fruit juice concentrate, honey, molasses
Single-ingredient sweeteners such as honey, maple syrup or a bag of table sugar are handled a little differently. According to the FDA, their labels may show the grams and %DV of added sugars in a footnote instead of the usual line, because the whole product is sugar.
Several small sweeteners can add up
A product can list three or four different sweeteners, each in a small amount, so no single name looks like much. The added sugars line on the panel gives the combined total.
How the label numbers compare with official daily limits
The Daily Values on the label are reference amounts for comparing foods. Dietary guidelines and the World Health Organization set intake goals, and they do not all use the same numbers. The table puts the three side by side for the lines that matter most.
| Nutrient | FDA Daily Value | US Dietary Guidelines 2025–2030 | WHO adults |
|---|---|---|---|
| Sodium | 2,300 mg | Less than 2,300 mg a day (age 14+) | Less than 2,000 mg a day |
| Added or free sugars | 50 g | No amount recommended; at most 10 g in one meal | Under 10% of energy; under 5% (about 25 g) for added benefit |
| Saturated fat | 20 g | Generally no more than 10% of daily calories | Not covered here |
The 50 g added sugars Daily Value matches the earlier US advice of keeping added sugars under 10% of daily calories, which the FDA still cites. The 2025–2030 guidelines go further, stating that no amount of added sugars is recommended as part of a healthy diet and capping one meal at 10 grams. The WHO recommends keeping free sugars under 10% of energy intake and suggests that going below 5%, roughly 25 grams a day, brings extra benefit.
For children, the US guidelines set lower sodium limits by age: less than 1,200 mg a day for ages 1–3, less than 1,500 mg for ages 4–8 and less than 1,800 mg for ages 9–13. The guidelines also advise avoiding added sugars in infancy and early childhood. When you shop for a child, the milligram figure is more useful than the %DV, which is set for a 2,000-calorie adult reference.
Which line to read first, by situation
| Situation | Read first | Rule of thumb | Why |
|---|---|---|---|
| Cutting back on salt | Sodium %DV | 5% or less per serving is low | Daily Value is 2,300 mg |
| Cutting back on sugar | Added sugars in grams | No more than 10 g in one meal | Total sugars include milk and fruit sugar |
| Eating more fiber | Dietary fiber %DV | 20% or more per serving is high | Daily Value is 28 g |
| Shopping for a child aged 4–8 | Sodium in milligrams | Less than 1,500 mg a day | %DV is set for an adult reference |
| Comparing two brands | Serving size | Match the serving before comparing %DV | %DV only compares at equal servings |
Rules from the FDA guide to the Nutrition Facts label and the Dietary Guidelines for Americans 2025–2030 · general guidance, not individual medical advice
If you are reading labels as part of a weight goal, the calories line connects to a daily target; this guide to a safe calorie deficit per week shows how big that gap should be. For a quick body measure, the BMI calculator gives an estimate for reference, and BMI vs body fat percentage explains what each number can and cannot tell you. Anyone with a medical condition or a diet prescribed by a clinician should follow that advice over the general rules on a label.
Sources checked · 2026-10-20 checked
- FDA: How to Understand and Use the Nutrition Facts Label · FDA
- FDA: Daily Value on the Nutrition and Supplement Facts Labels · FDA
- FDA: Added Sugars on the Nutrition Facts Label · FDA
- Dietary Guidelines for Americans 2025–2030 · USDA and HHS
- WHO fact sheet: Sodium reduction · WHO
- WHO: Guideline on sugars intake for adults and children · WHO
- %DV math for three illustrative labels, worked out 2026-10-20 · %DV = amount ÷ FDA Daily Value × 100 · cereal 10 g ÷ 50 g = 20%, 2 cups 20 g = 40% · sodium 400 ÷ 2,300 = 17% · yogurt 9 ÷ 50 = 18%, calcium 160 ÷ 1,300 = 12% · frozen tray 1,380 ÷ 2,300 = 60%, 1,380 ÷ 2,000 = 69% · saturated fat 10 ÷ 20 = 50%
Try it with your own numbers:
- BMR and Daily Calorie Calculator — get your own daily calorie number to read %DV against.
FAQ
Is the 2,000-calorie basis on labels right for me?
Should I add up the %DV of everything I eat in a day?
Is a food with 20% DV or more always a poor choice?
Are the three example labels real products?
In three lines
- Read the serving size first and multiply every line by the servings you actually eat
- On the %DV column, 5% or less per serving is low and 20% or more is high
- Keep added sugars, sodium and saturated fat low, and look for higher fiber, calcium, iron, potassium and vitamin D
By Jay · Runs the JLOGUE everyday calculators · checks official sources
Checked FDA Nutrition Facts guides, the Dietary Guidelines for Americans 2025–2030 and WHO sodium and sugars guidance; example label math done 2026-10-20 · Draft assisted by AI; figures, tables and links checked by hand.